

A configuration is what your results ran on, such as a browser or a device. Your project names it, so the report says Browsers or whatever your project calls them. The examples on these pages use a storefront project that names them Browser.
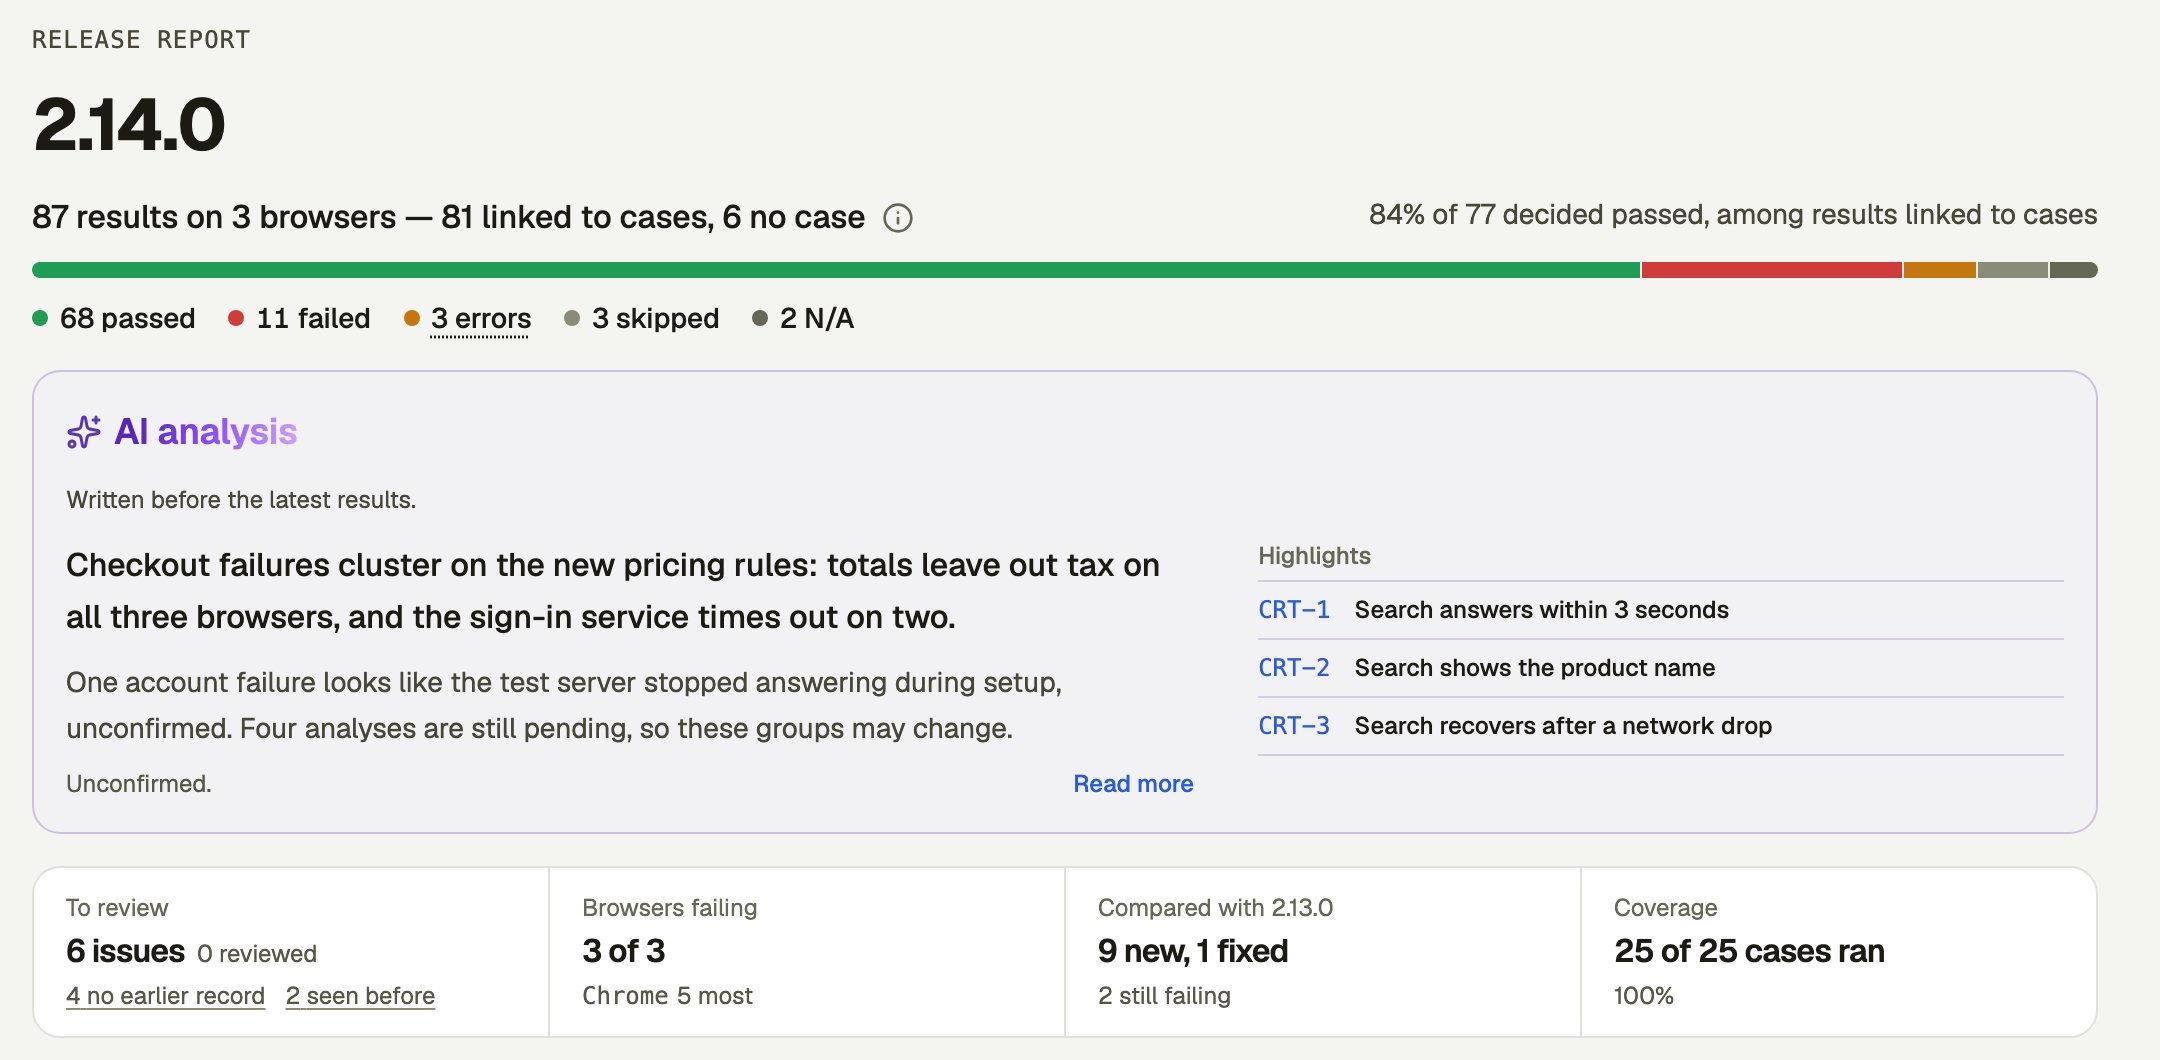
The results
The line under the release’s name says how many results it holds and on how many configurations. The bar and the counts under it split them by outcome, and the line above the bar’s right end gives the pass rate: passed results out of those decided, meaning passed, failed or errored. When some results aren’t linked to a test case, the bar includes them and the pass rate doesn’t, and the line says so. Select the info icon for what the counts mean. When one issue holds a large share of the failures, the report names it, such as 8 of 14 failures are one issue, with a View issue link. Short notes appear under the results only when they apply:
A things worth a look link goes to Run health when it lists anything.
AI analysis
The AI analysis card summarizes the failures and lists highlights, each linked to its test case. Select Read more for the rest. The analysis is always marked Unconfirmed. It suggests where to look, and any cause it names is a lead to check, not a finding. It never changes a result or clears a failure. Whether to ship is your decision. A note says so when it was written before the latest results.Key facts
Four or five facts sit under the analysis. Some numbers are links or filters.
Below these sit the report’s three tabs.
Comparison
Comparison shows what changed against another release. Compare with picks the release; it starts on the nearest earlier release that shares a result with this one.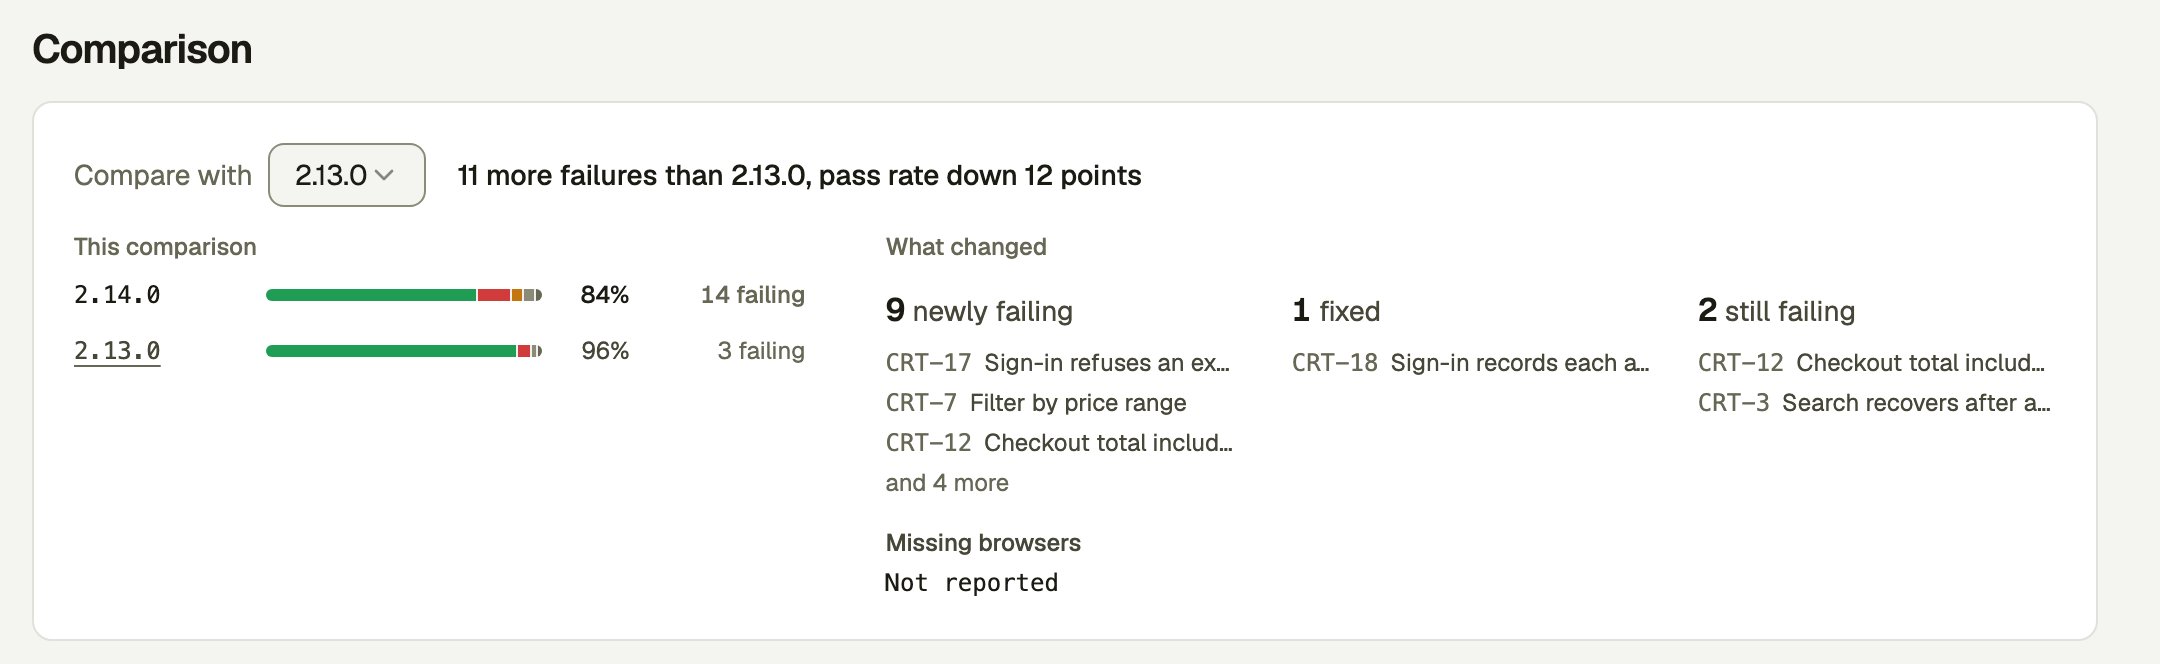
- Newly failing, Fixed and Still failing list the results that changed, or didn’t, with the test cases they belong to.
- Missing and New configurations list those in only one of the two releases, under your project’s name for them. They appear only when the two differ.
- Recent releases shows other releases’ pass rates beside this one’s, so you can see the trend.
Coverage
Coverage says how many of the project’s test cases ran in this release, and how many of those linked to a result have a failure. A bar for each top-level folder shows the same count per folder, when your test cases are in folders.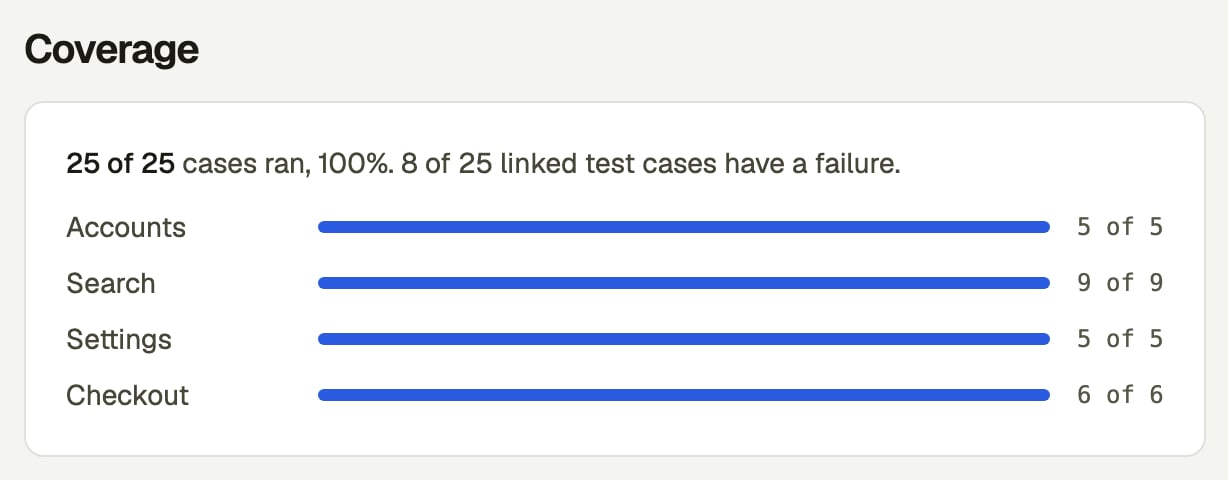
Run health
Run health says whether every result is filed and whether its analysis settled. It lists only what needs a look, one row per item, each with a short status and what it means.
A spinner marks a row Peeps is working on, and its count updates as results arrive. Rows without one need a look, or are waiting on a person.
Rows can link to the sessions they’re about or open the questions they need answered. When a part has nothing to report it says All results filed or Analysis settled. When neither has, the card says Ran cleanly.
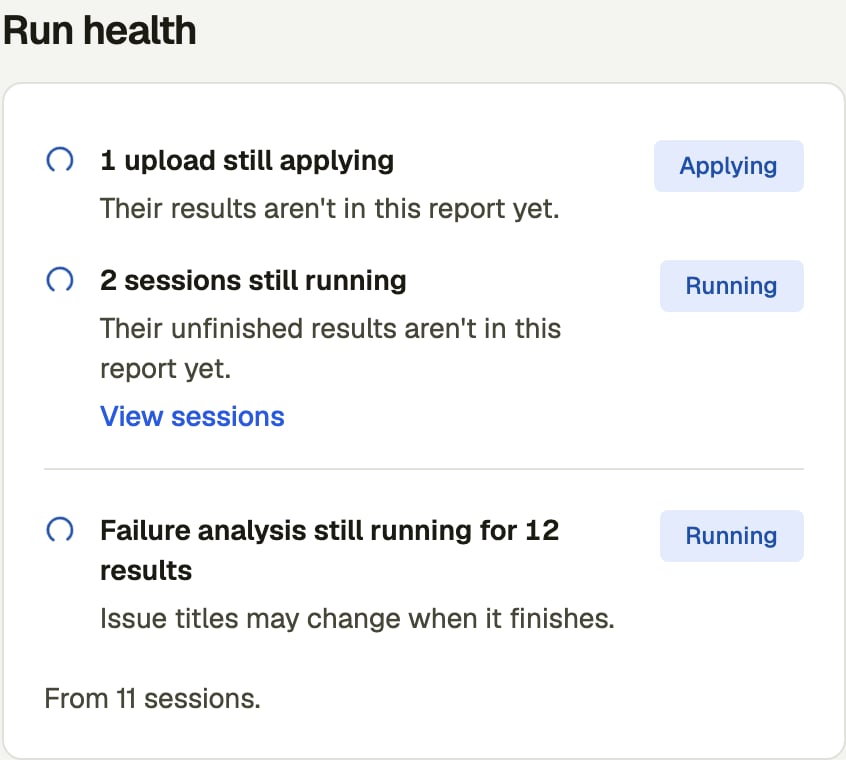
While results are arriving
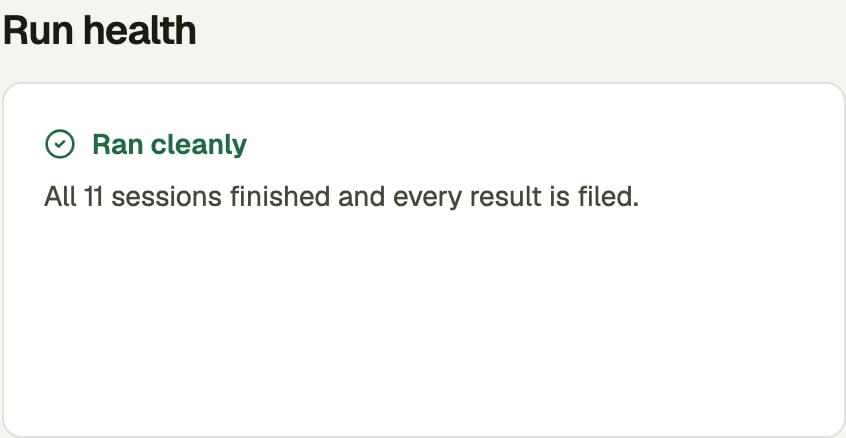
When everything is filed
Further down the page
- Not linked to a case yet lists results Peeps can’t file under a test case, when there are any. Contributors can map them from here.
- Configurations in this release lists each configuration. It carries your project’s name for them.
- Runs lists the batches, manual runs and single runs in the release. See Add runs to a release.
- Sessions lists the sessions that sent results, with anything your test harness reported about them.